Raleigh’s “Weak and Declining” Real Estate Market
However, for me the information as published doesn’t really provide sufficient data to actually glean the ‘trend’. The market trends reports gives year to date new listings and closed sales and it even compares current activity to last year, but for me, that’s just not good enough.
You see, it really doesn’t matter to me how June 2014 activity compared to June of last year because 1) I cannot travel back in time and B) what real value does last year’s data provide a prospective homebuyer today?
My clients never ask me, ‘what did this house cost last year?’ Instead, even though I am not a realtor, my clients ask me ‘where do you see the Raleigh – Cary market headed?’ In other words, they want to know if prices in Wake County are headed up or down and the reports simply don’t provide enough insight.
That’s why each month when the report comes out, I take the data from the Wake County Real Estate Markets Trends Report and plug it into my own table to assemble the data in a more meaningful way. For example, I find month over month comparisons to be far more valuable to local buyers of real estate than year over year for the reasons mentioned before.
8 Data Points to Evaluate Your Real Estate Markets Health
- New Vs. Closed Listings
- Absorption Rates
- Inventory
- Months’ Supply of Inventory (MSI)
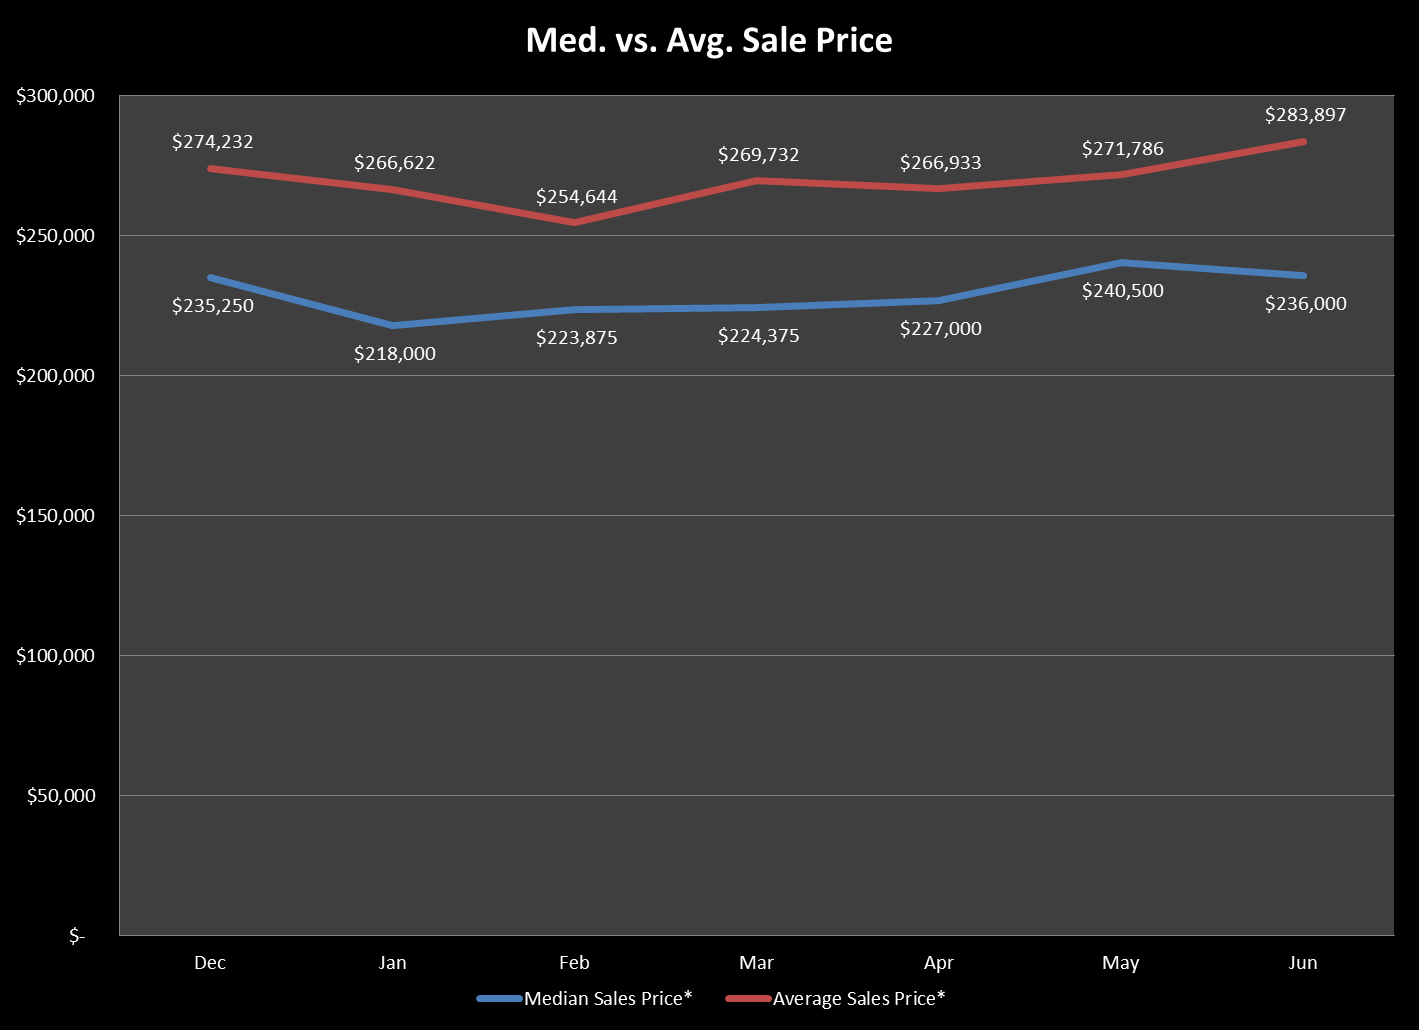
- Median Vs. Average Sale Price
- Percent of Original List Price received
- Percent of Final List Price Received
- Days on Market (DOM)
Since relocating from Northern Michigan in 2007 I have lived in Garner (27529) with my wife Melanie and our four children. With personal production of 8MM in real estate sales across Southern Wake County I am considered to be a local market expert in the following communities: Garner (27529), Fuquay-Varina (27526), Holly-Springs (27540), Apex (27502), and Raleigh (27603, 27604, 27606, 27609, 27610)) which spans from downtown Raleigh to Willow Spring including Lake Wheeler. Call or email me, I’m here to help! Ricardo Cobos (919) 526-0183